Problem
Food inspections prevent food-borne illness, but inspectors have limited time. If the risk category of an inspection could be predicted, inspections could be prioritised. This was the capstone for the IBM Data Science Professional Certificate.
Approach
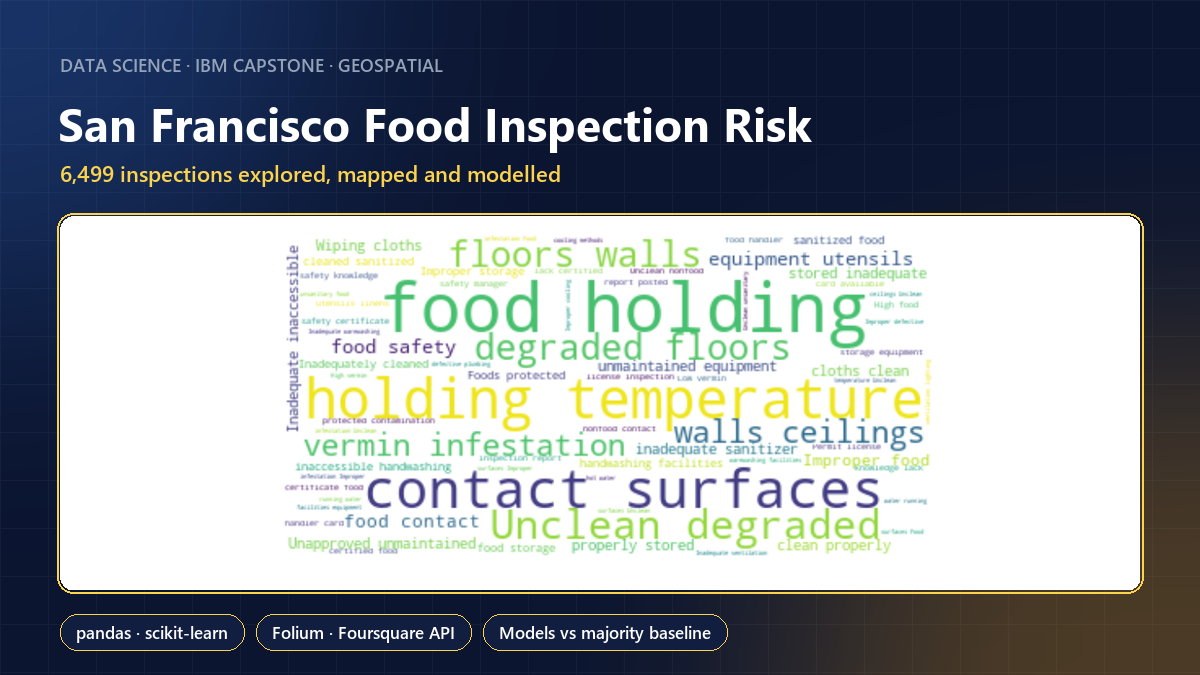
- 6,499 inspections from 2014–2016: grouped by risk category and year, with a word cloud of violation descriptions.
- A Folium map of inspection locations, and Foursquare API calls for nearby venues, ratings and tips.
- KNN (best k chosen by accuracy) and logistic regression to predict low, moderate or high risk.
Result
- 3,468 low-risk, 2,245 moderate-risk and 786 high-risk inspections; the most common violations were food holding temperature, unclean contact surfaces and degraded floors.
- KNN (k = 6) and logistic regression both reached 0.52 test accuracy, about the same as always predicting "low risk" (0.53). Score, year and weekday don't carry enough signal; violation history would be the next feature.
What this shows
The full data science method, from business problem to data plan, exploration, mapping, API enrichment and modelling, with the result compared to a baseline. The published notebook reads its API keys from environment variables and no longer explores an individual reviewer's profile.