
Problem
The Maven Analytics Tour de France Challenge: turn 120 years of race data into a dashboard that tells the story of the race at a glance.
Approach
- Power Query to clean and join the stage, rider and winner tables.
- DAX for finisher rates, winner averages and rankings.
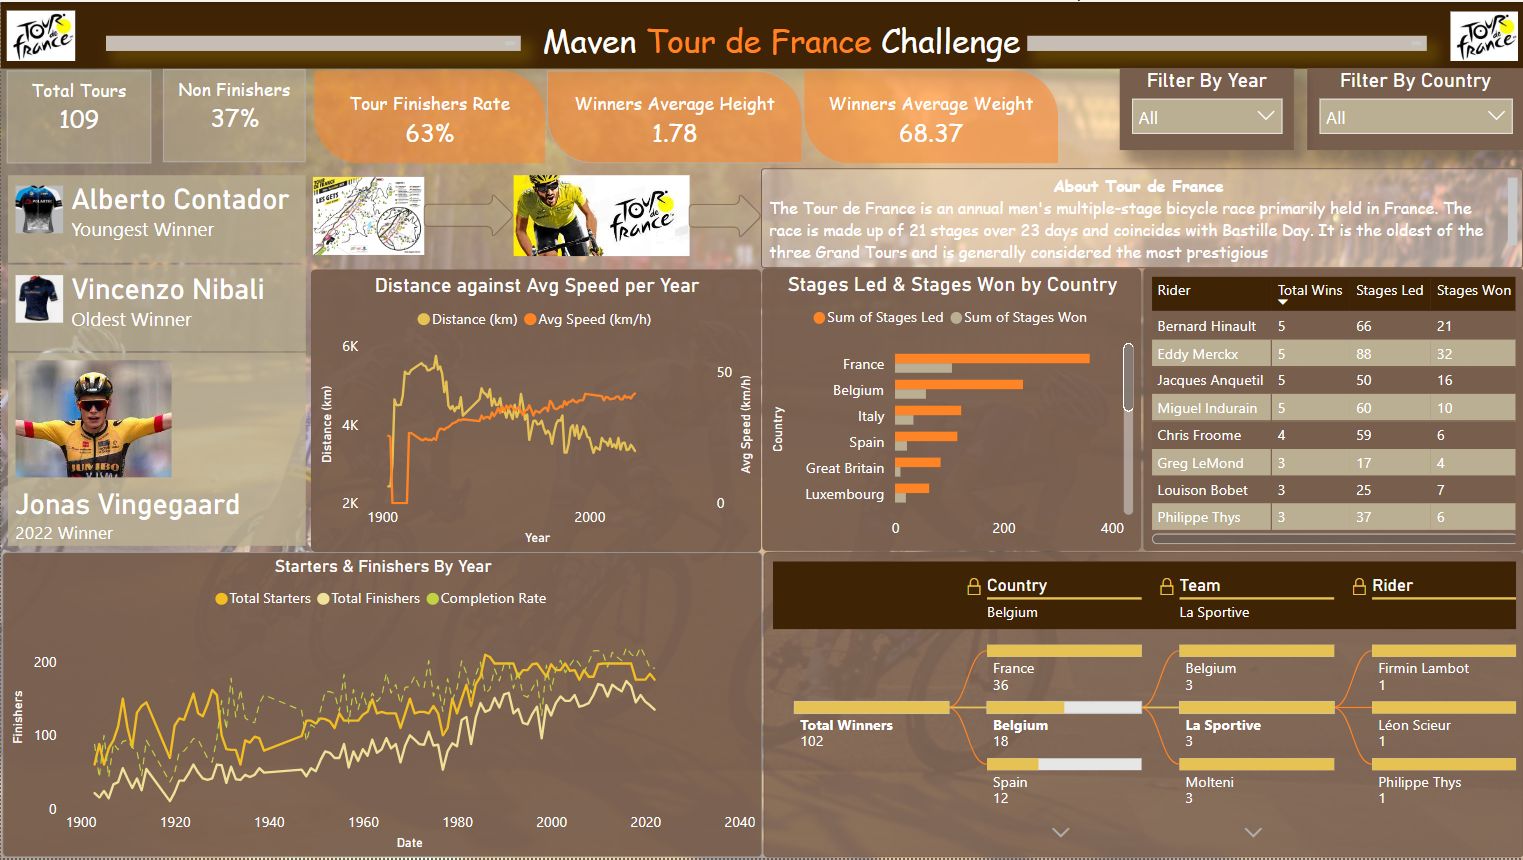
- Line charts of distance against average speed, starters against finishers, stages led and won by country, a rider table, and a decomposition tree of winners by country, team and rider.
Result
- 109 Tours, a 63% finisher rate, winners averaging 1.78 m and 68.4 kg; races got shorter after the 1920s while average speed kept rising.
- Review finding: the "youngest winner" card shows Alberto Contador and the "oldest winner" card shows Vincenzo Nibali, but the real answers are Henri Cornet (1904, aged 19) and Firmin Lambot (1922, aged 36). The age measure most likely only covers winners with a birth date in the data; the fix is to calculate age at the race date for every winner and flag missing birth dates.
What this shows
Power BI modelling and visual design, and checking a dashboard's headline numbers against known facts before anyone relies on them.