Problem
Mental health services in Zimbabwe are stretched and stigma stops many people from asking for help. A clear view of who is struggling, why, and what stops them getting help lets NGOs and planners target support.
Approach
- Survey data from the Data Science Zimbabwe community, cleaned and reshaped in Power Query.
- DAX measures for respondent counts and ratios, and slicers for gender, marital status and age range.
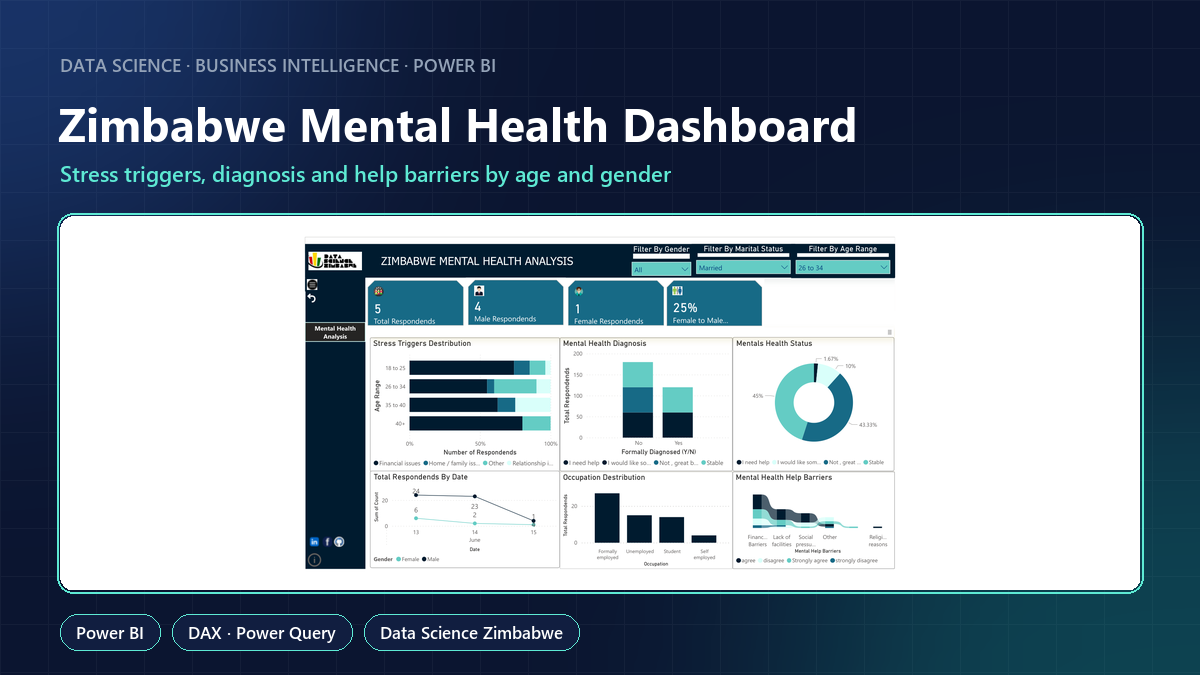
- Visuals for stress triggers by age, formal diagnosis, current mental health status, occupation and help barriers.
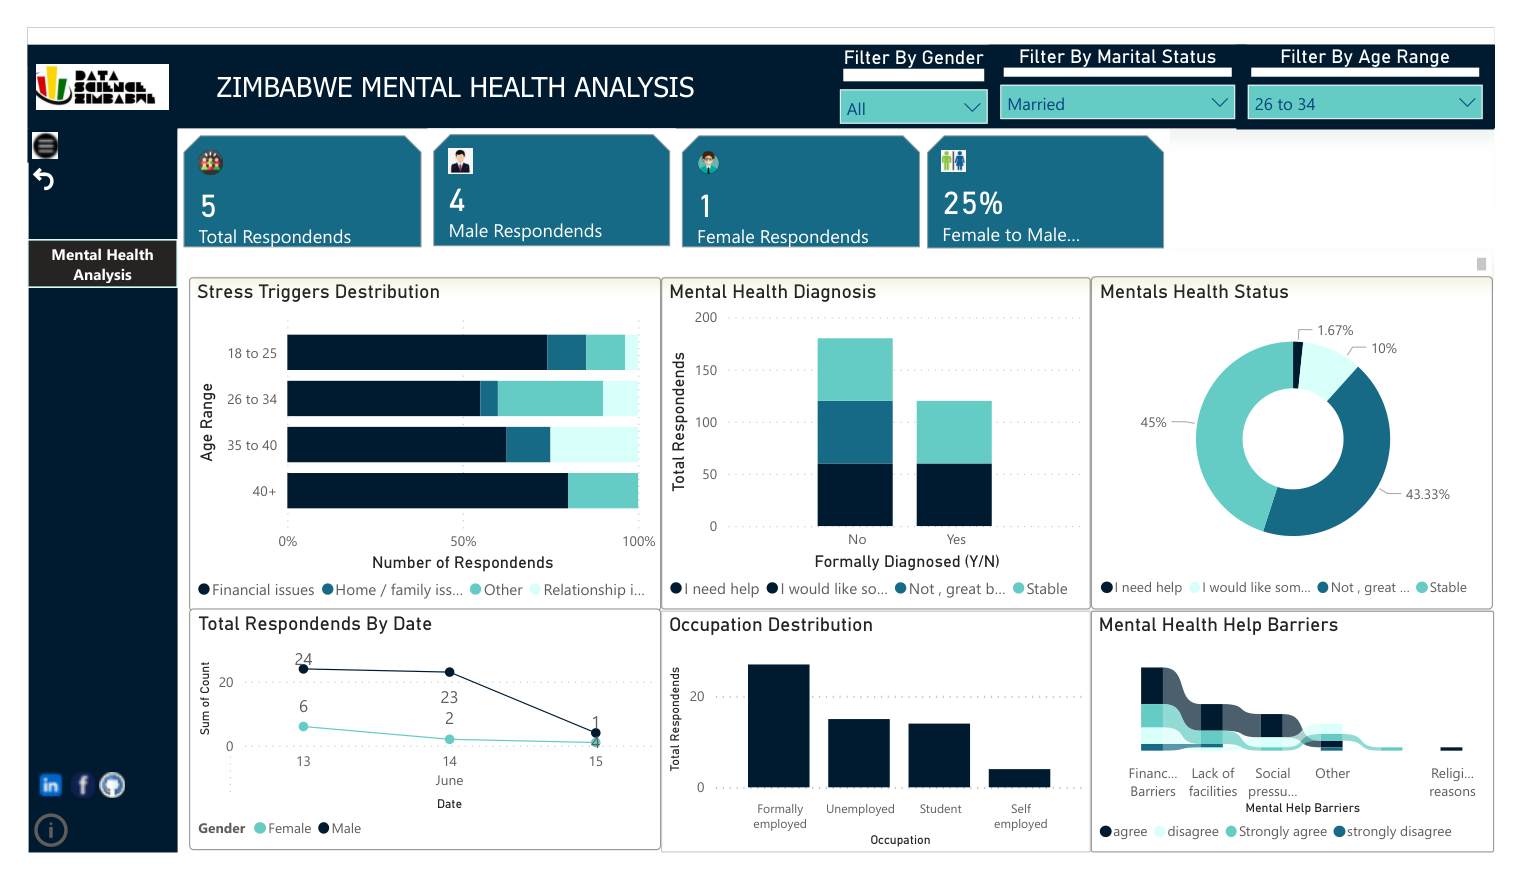
Filtered here to married respondents aged 26–34.
Result
A one-page interactive report where every visual responds to the gender, marital-status and age slicers, so a user can compare stress triggers, diagnosis rates and help barriers between groups in a few clicks. The survey is a small, self-selected sample, so the figures describe the respondents, not the population; narrow filters (like the 5 respondents above) are too small to draw conclusions from.
What this shows
Survey analysis and dashboard design in Power BI, with clear caveats about sample size.