Problem
Park managers, researchers and visitors need one place to see which parks hold which species. This dashboard prototypes that interface for Zimbabwe's parks.
Approach
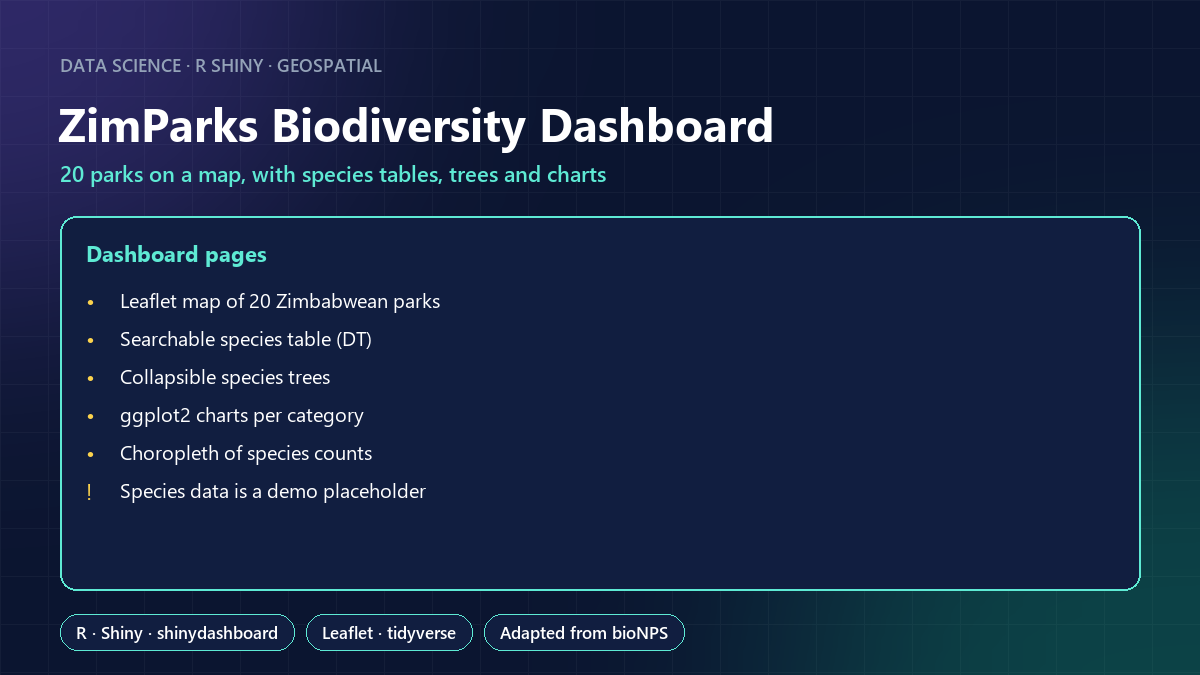
- A Leaflet map of 20 parks (Hwange, Gonarezhou, Mana Pools, Matobo, Victoria Falls and others) with real coordinates.
- A searchable species table, collapsible species trees (park → category → order → family), ggplot2 charts and a choropleth of species counts.
- Adapted from the open-source bioNPS Shiny app, with credit.
Result
A working prototype, deployed on shinyapps.io in 2021. Honest note: the species table is a placeholder (the US National Park Service dataset relabelled with Zimbabwean park names), and the choropleth still uses US state boundaries. The next step is real records from GBIF and Zimbabwe's provinces.
What this shows
Building a multi-view Shiny dashboard with maps, tables, hierarchies and charts, and documenting clearly what the data does and doesn't represent.