Portfolio
Projects
Business intelligence, analytics dashboards, and machine learning.
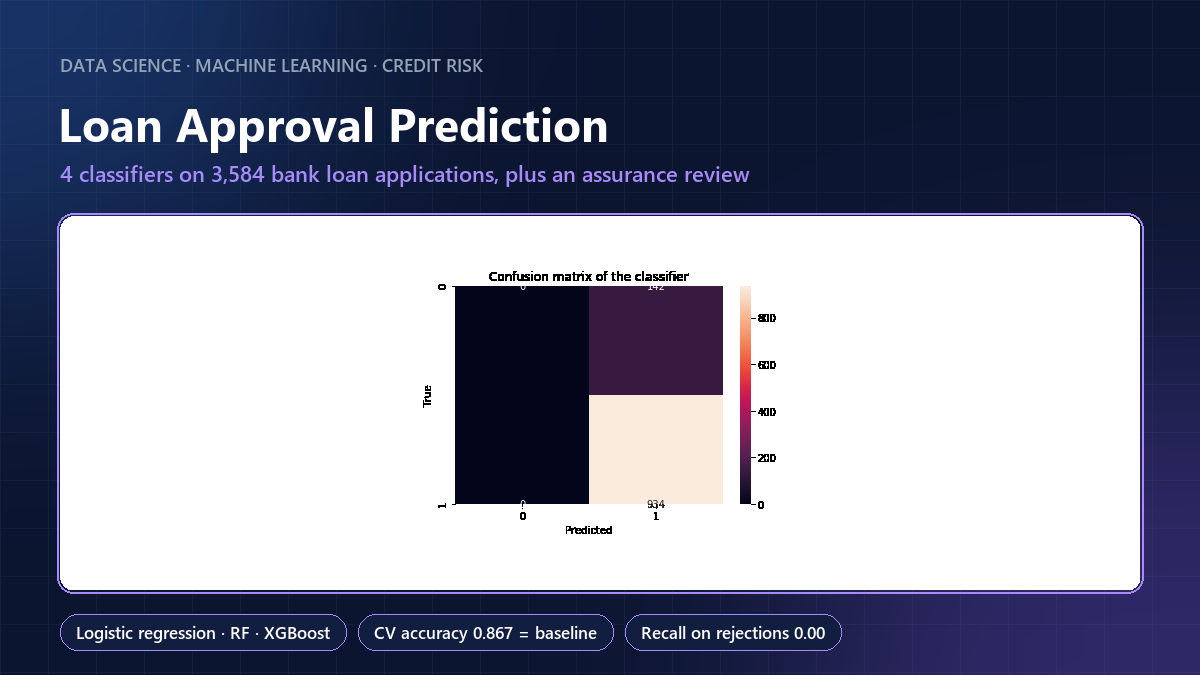
Loan Approval Prediction with an Assurance Review
Four classifiers predicting loan approval on 3,584 applications from a commercial bank, and a review showing why 87% accuracy only matched the always-approve baseline: the model never predicted a rejection.
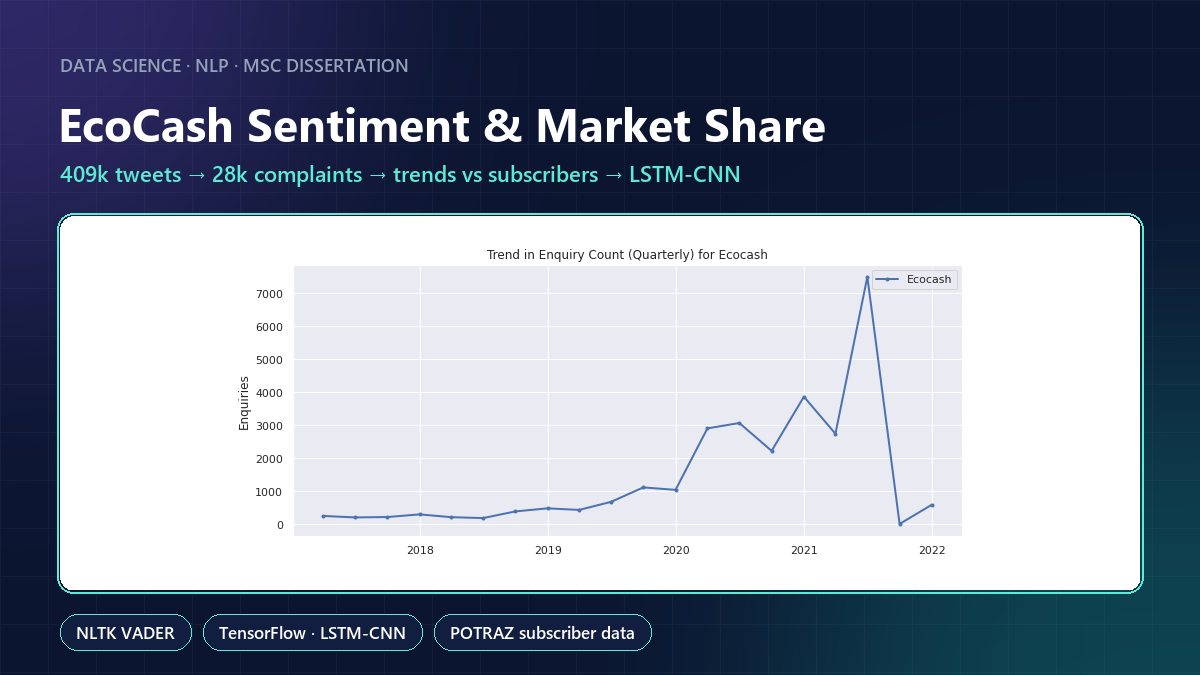
EcoCash Sentiment & Market Share (MSc Dissertation)
MSc dissertation: 409,453 tweets about EcoCash cleaned to 28,455 customer complaints, scored with VADER, compared with regulator subscriber data, and an LSTM-CNN forecast of active subscribers.
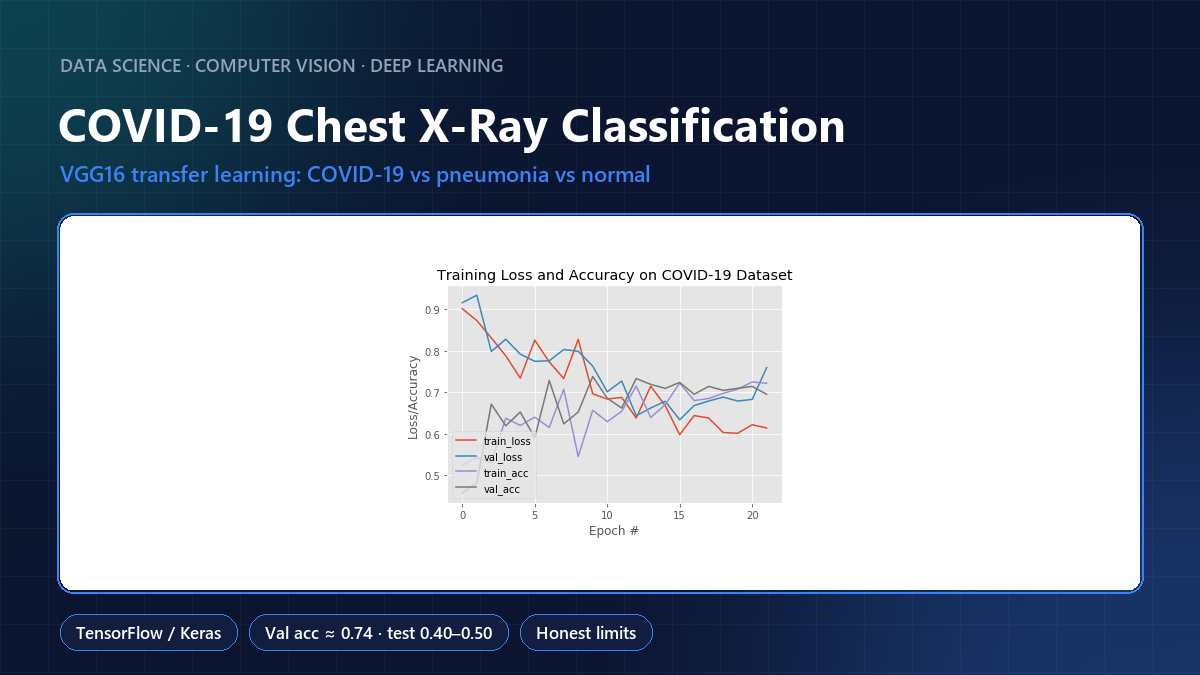
COVID-19 Chest X-Ray Classification (VGG16)
Transfer learning with VGG16 to classify chest X-rays as COVID-19, pneumonia or normal, with augmentation, early stopping and fine-tuning, and an honest look at why it didn't generalise.
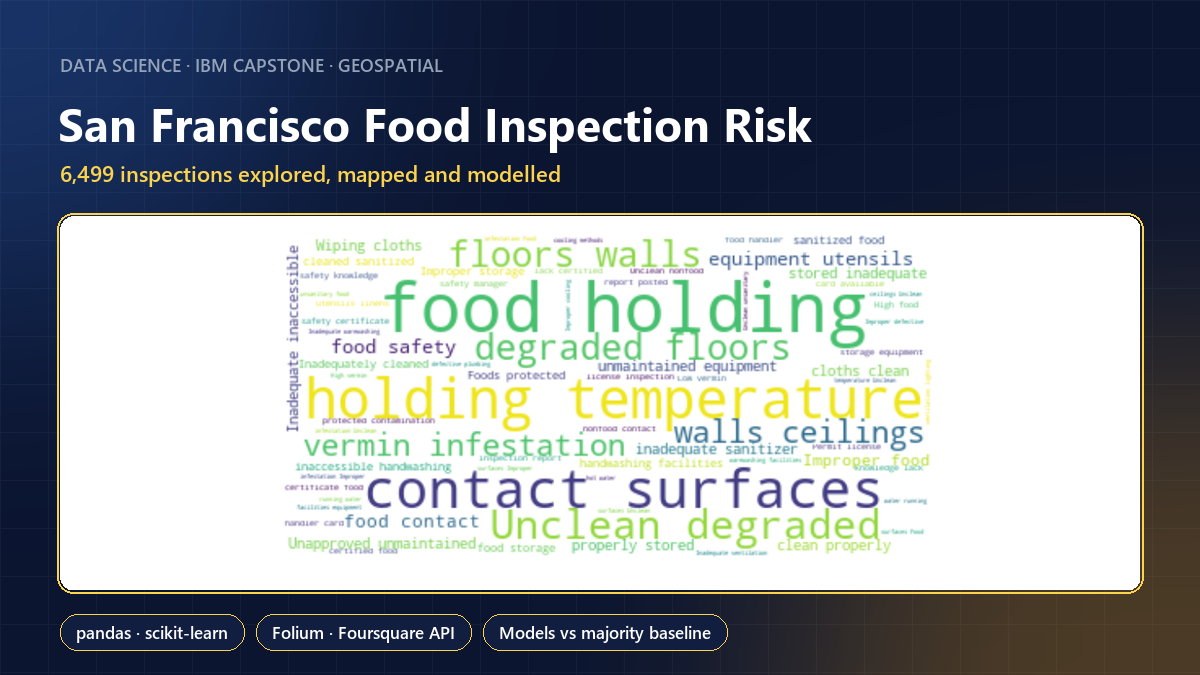
San Francisco Food Inspection Risk (IBM Capstone)
IBM Data Science capstone: 6,499 San Francisco restaurant inspections explored, mapped with Folium, enriched with Foursquare venue data, and modelled with KNN and logistic regression against a majority-class baseline.
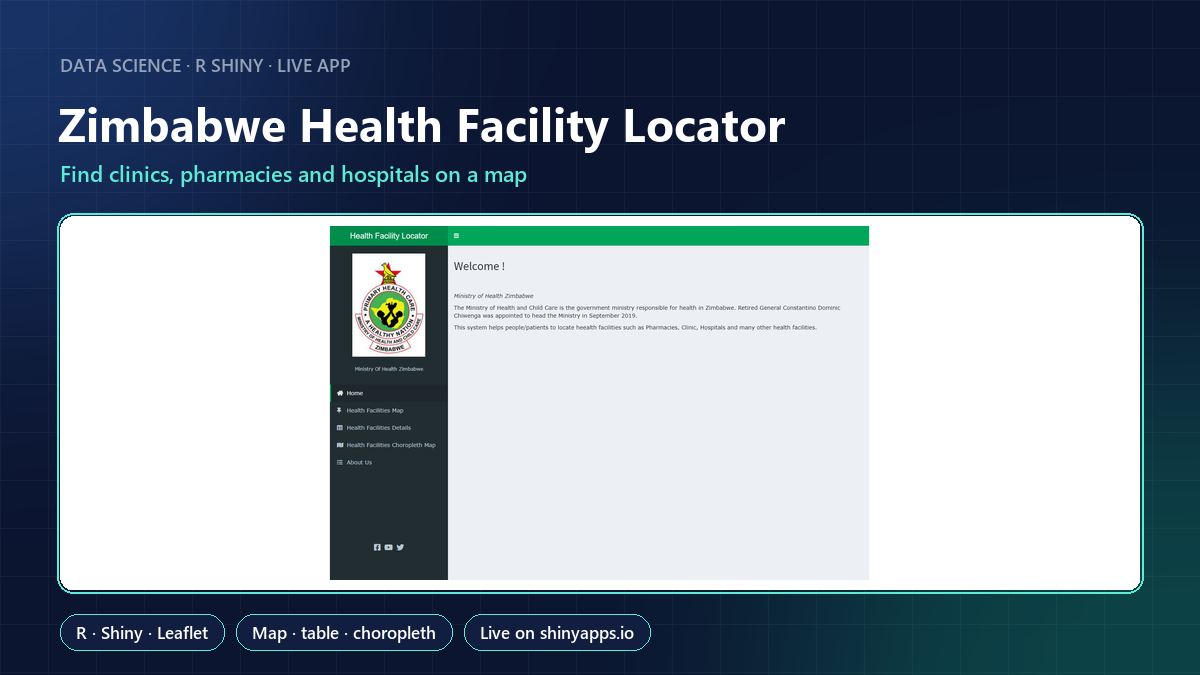
Zimbabwe Health Facility Locator (R Shiny)
A live R Shiny web app that helps people find clinics, pharmacies and hospitals in Zimbabwe on a map, in a searchable table and by region.
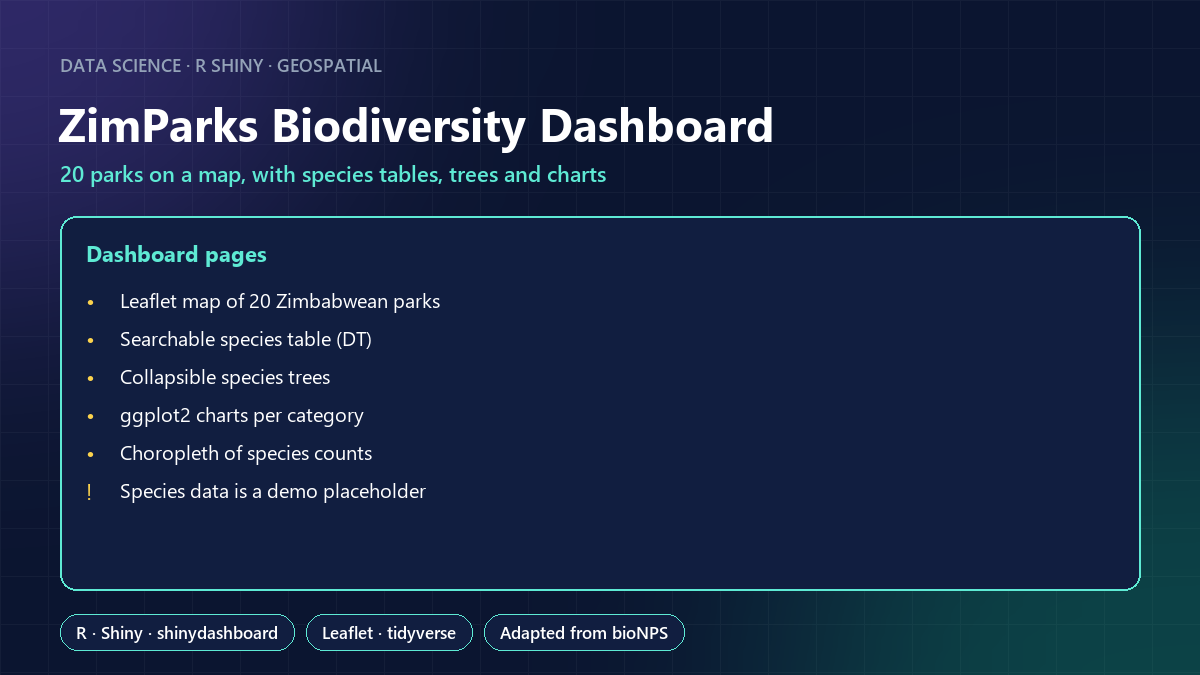
ZimParks Biodiversity Dashboard (R Shiny)
An R Shiny dashboard mapping 20 Zimbabwean national and recreational parks, with species tables, collapsible species trees, charts and a choropleth. Built on a demo species dataset.
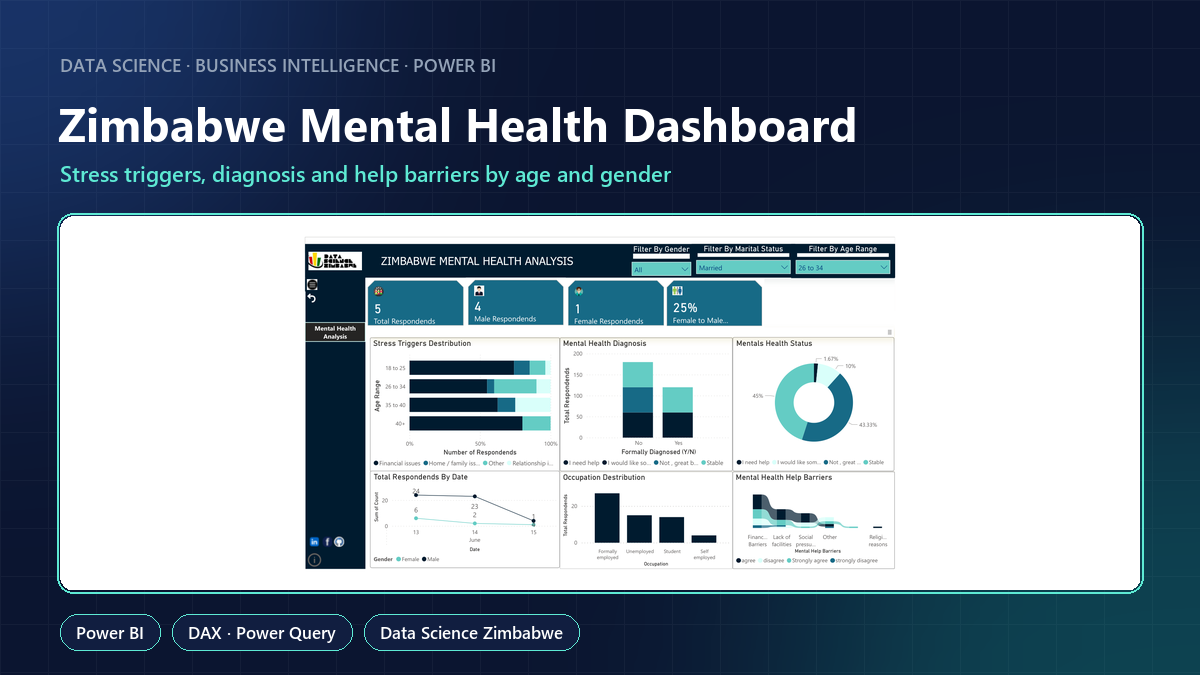
Zimbabwe Mental Health Dashboard (Power BI)
An interactive Power BI dashboard of a Zimbabwean mental health survey: stress triggers, diagnosis, current status and barriers to getting help, filterable by gender, marital status and age.
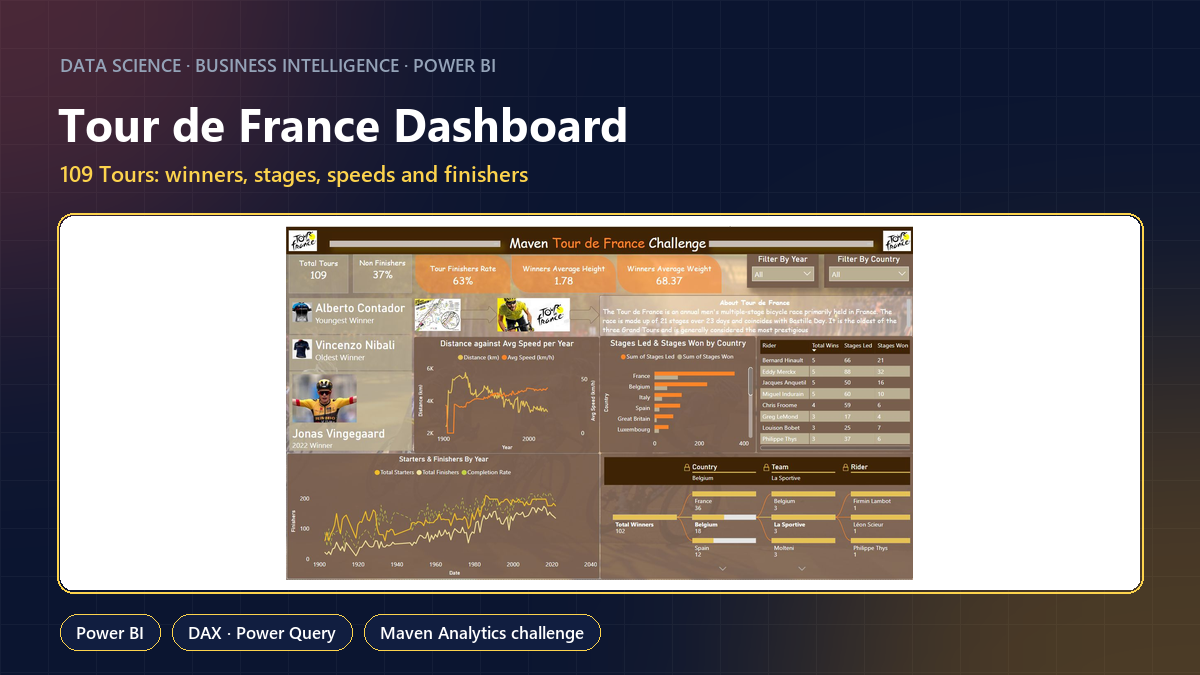
Tour de France Dashboard (Power BI)
A Power BI dashboard for the Maven Analytics Tour de France Challenge: 109 editions of winners, stages, speeds and finishers, plus a review that caught two wrong headline cards.